BAR CHARTS
Bars must start at zero
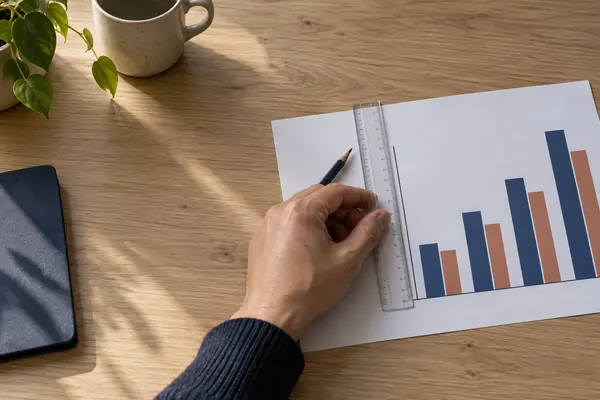
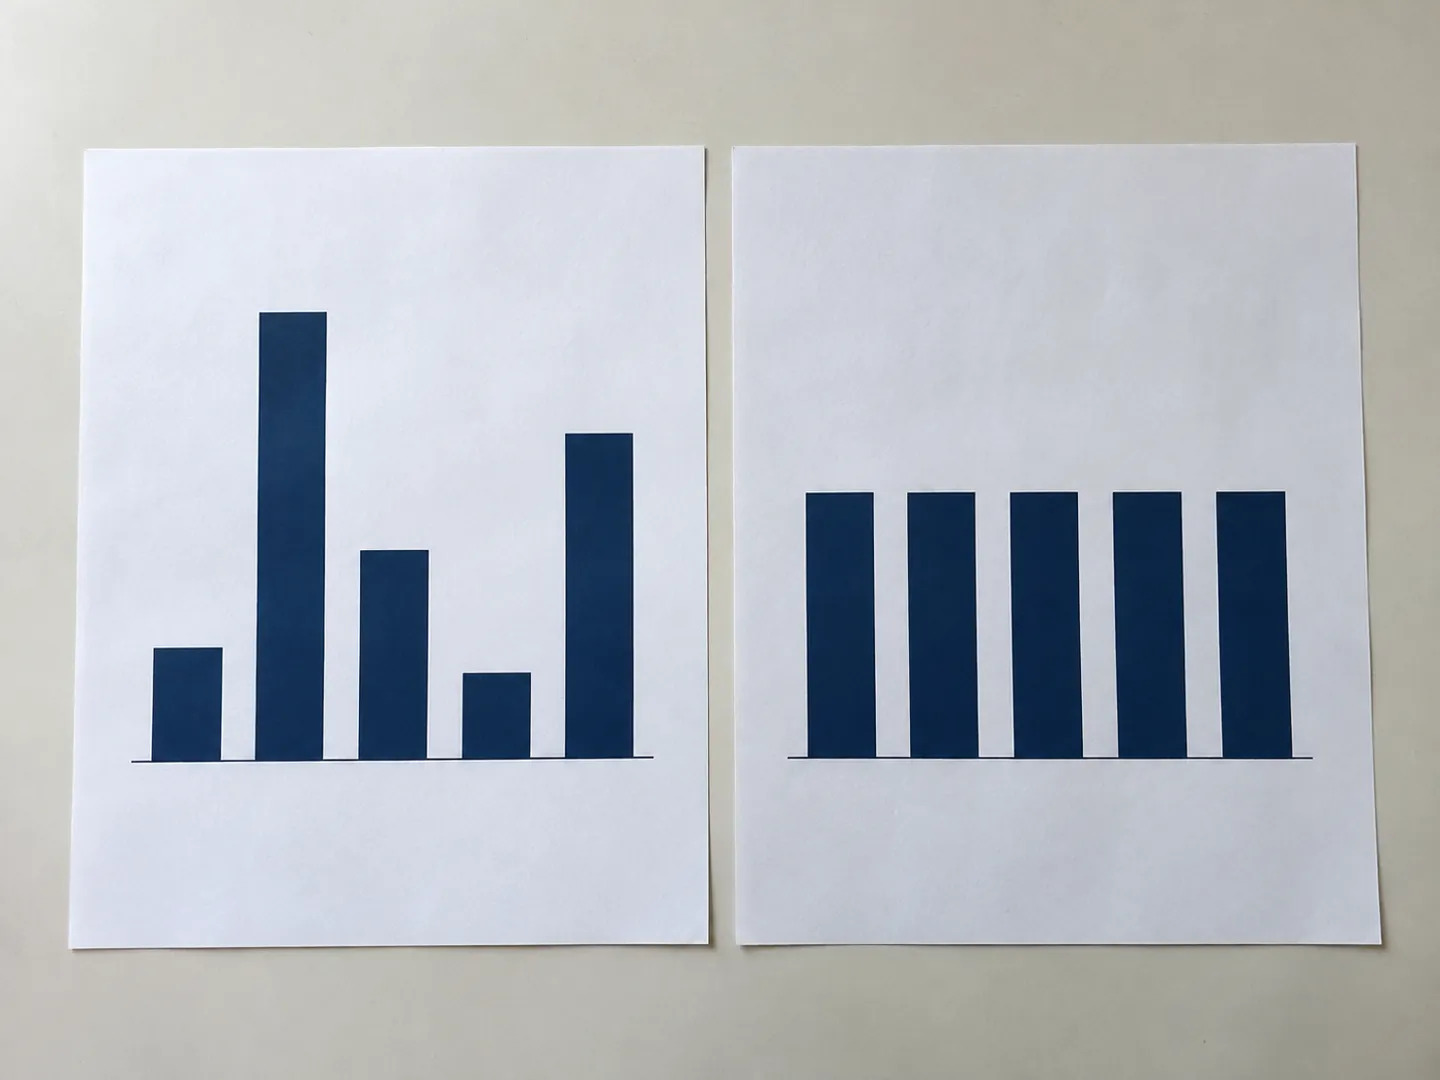
We read bars by their length. The ONS service manual says the axis should always start at zero for bar and area charts, or the lengths stop matching the numbers.
Check a chart typeWHAT THE GUIDANCE SAYS
A chart can be accurate and still mislead.
The numbers may all be right, yet a cropped axis, a second scale or the wrong chart type can make a change look far bigger or smaller than it is. UK government guidance sets out a few simple rules.

BARS START at zero
THE SHORT ANSWER
Most misleading charts use true numbers.
The trick is in how they are drawn.
BAR CHARTS
We read bars by their length. The ONS service manual says the axis should always start at zero for bar and area charts, or the lengths stop matching the numbers.
Check a chart typeLINE CHARTS
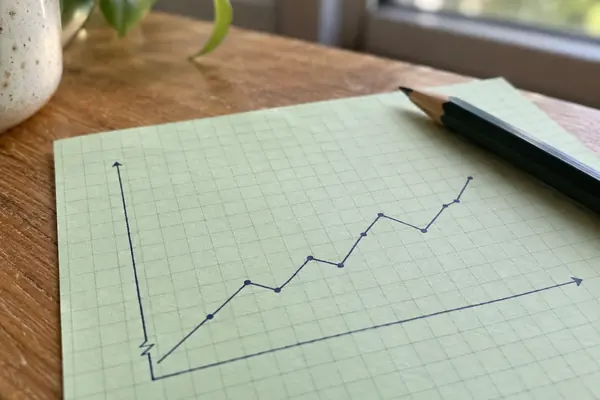
Lines are read by position, so guidance allows a cropped axis to show a trend. The break should be clearly marked and mentioned in the text.
How to read oneSCALES
The Analysis Function advises against dual axis charts because how the lines sit together can change the story, even by accident.
See the examplesA QUICK CHART CHECK
Pick a chart type to see what UK government guidance says about its axes and scales. The bar shows how firmly the guidance sets the rule.
Based on the ONS service manual on axes and gridlines and the Government Analysis Function guidance on charts.
TWO EXAMPLES WORTH KNOWING
One example from the ONS digital blog,
one from the UK statistics regulator.
0.27 points
Real gap between two age groups
On a cropped bar chart, people aged 16 to 19 looked almost twice as happy as those aged 20 to 24. The real difference in their average rating was 0.27 points.
HAPPINESS RATINGS · ONS BLOG
8%
Where the y-axis began
The Office for Statistics Regulation called a February 2023 inflation bar chart misleading because its y-axis began at 8%, exaggerating how fast inflation was falling.
INFLATION CHART · OSR, 2023
The regulator added that a clearly labelled axis break would not have fixed it. A 2020 set of crowd-sourced experiments found the same: the effect of a cropped axis persisted even when the chart showed an explicit cue that it was cropped.
FOUR CHECKS TO TRY
None of these needs maths. They take a few seconds and work on charts in the news, in reports and on social media.
If bars do not start at zero, compare the numbers, not the heights.
With two y-axes, where the lines sit is a design choice. Read each line against its own scale.
Good charts say what the data is, where it covers and the time period shown.
A longer time span or a target line can change the picture completely.
TIME AND CONTEXT
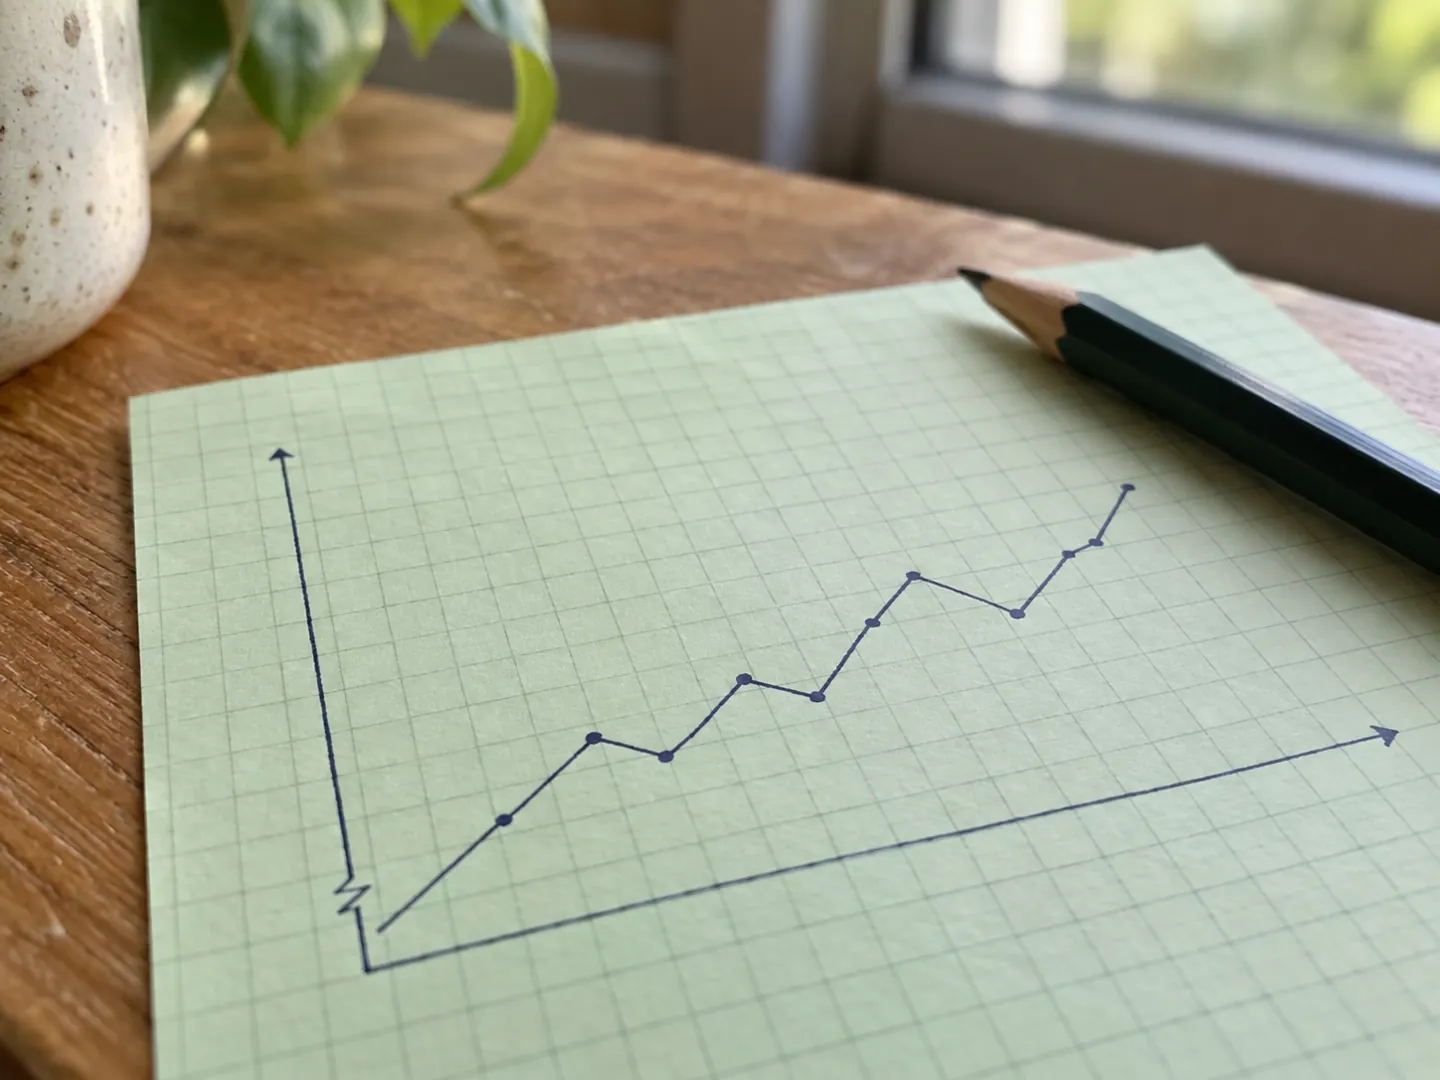
An ONS blog showed MMR vaccination rates in England. On a 0 to 100 axis they looked steadily high; zoomed in, a clear dip and recovery appeared. Stretching the years shown gave a different picture again.
Adding the World Health Organization's 95% coverage target changed the message once more, because UK levels in the chart never reached it. Context lines are part of honest charting.
Questions
No. UK guidance says bar and area charts should, because they are read by length. Line charts and scatter plots can use a cropped axis when that shows the trend more clearly, with the crop made obvious.
Not according to the Office for Statistics Regulation, which said a clearly labelled break would not have stopped a 2023 inflation bar chart from being misleading. Research has also found the effect persists despite such cues.
The Analysis Function says the way lines are displayed in relation to each other can manipulate the data story, even when that is not intended. It recommends separate charts, each with its own y-axis.
The Analysis Function suggests pie charts only for five categories or fewer, with one clearly dominant category. Order the slices by size and start the first at 12 o'clock.
Government guidance recommends two titles: a headline that gives the main message, and a statistical subtitle saying what the data is, the geography and the time period.
Sources
ABOUT THIS NAME
doodlechart.com is part of the DoodleSale portfolio. It isn't in an auction right now, but you can ask about leasing it.